
United Way
Many United Way organizations rely on a central database like Andar, but also have executives creating and maintaining side Excel sheets. These side sheets sometimes track things like event attendance by major donors, or internal projections of how much specific donors are expected to contribute to the current campaign.
Precision Analytics Group joined forces with Alteryx for Good to conduct a free webinar that attracted several United Way data analysts. This session was a short course on how Alteryx can combine all of United Way’s data into a single, more useful composite – all without affecting the original data in any way. This is just one example of Alteryx for Good in action.
View the webinar :
At Metro United Way in Louisville, leaders wanted to track the success of their funding campaigns in more insightful ways than feeding Andar tables directly into Tableau or Excel charts. They adopted Alteryx to enable monitoring and forecasting with better accuracy and depth.
While most information resided in the Andar database, executives also maintained their own separate Excel sheets to track key elements. Alteryx intelligently combines these diverse data sources into a unified structure.
For example, each year executives developed an Excel sheet that projected what almost two thousand past donors would contribute to the year, and when the pledges would be made.
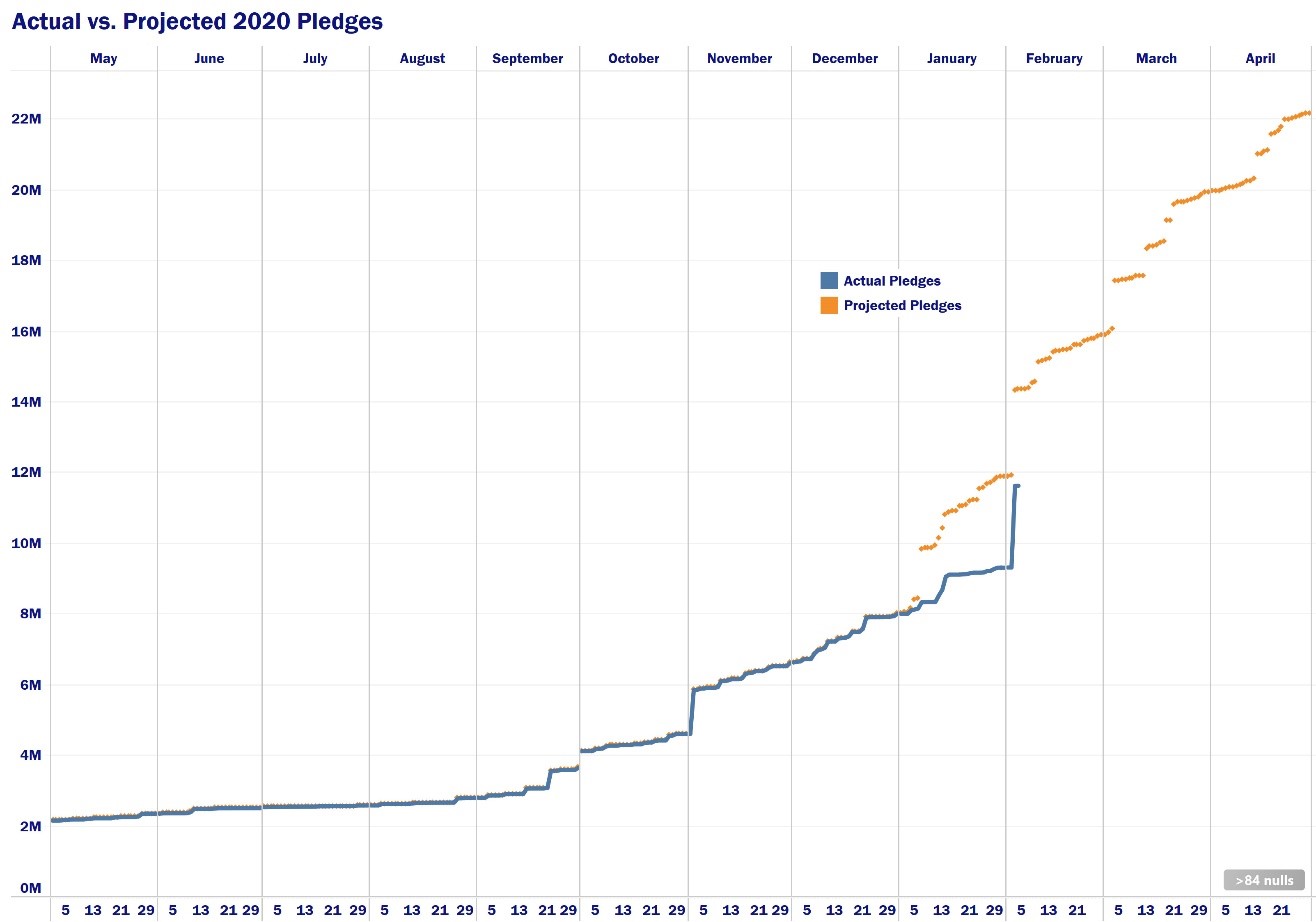
As pledges flowed into the Andar database, the Excel projections for future pledges grew unreliable: some donations arrived earlier than forecast and needed to be excluded from the “future” pledge expectations. In each weekly summary of campaign progress and future projections, Alteryx now deducts those who have already contributed from the flow of expected future pledges; if they’ve made a partial pledge, then only the remainder is still counted as an expected future donation. In the example below, the Metro United Way managers can see that pledges were behind their expectations for January.
Precision Analytics Group also developed a new campaign dashboard to show progress along several metrics. Each week Alteryx surveys the donations to date, and rapidly classifies them into “new” donors that haven’t been active recently, and “win back” donors that skipped the previous year’s campaign. Alteryx also compared this year’s progress to the previous year, to flag any lagging indicators.
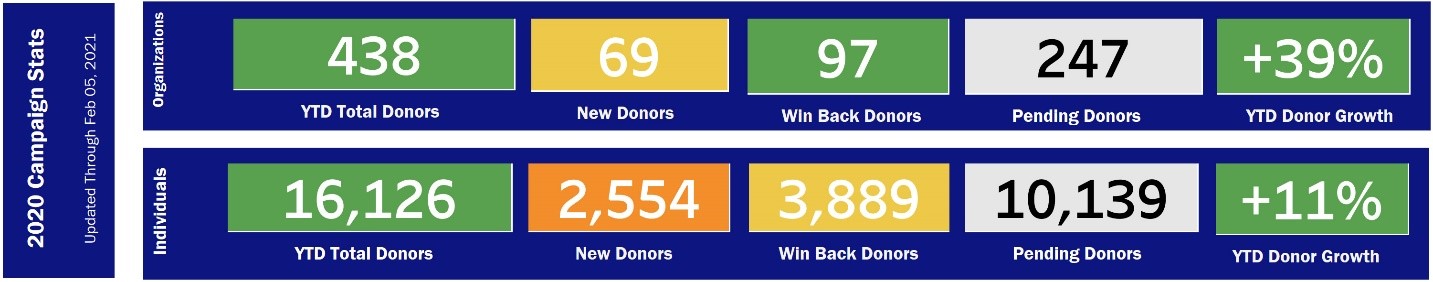
In the image above, green shading indicates improved performance compared to the previous year. Yellow signals a slight decline and the orange highlights a significant problem. Since an existing customer or donor base is any organization’s most precious asset, this type of monitoring of the success (or failure) to use that base is crucial.
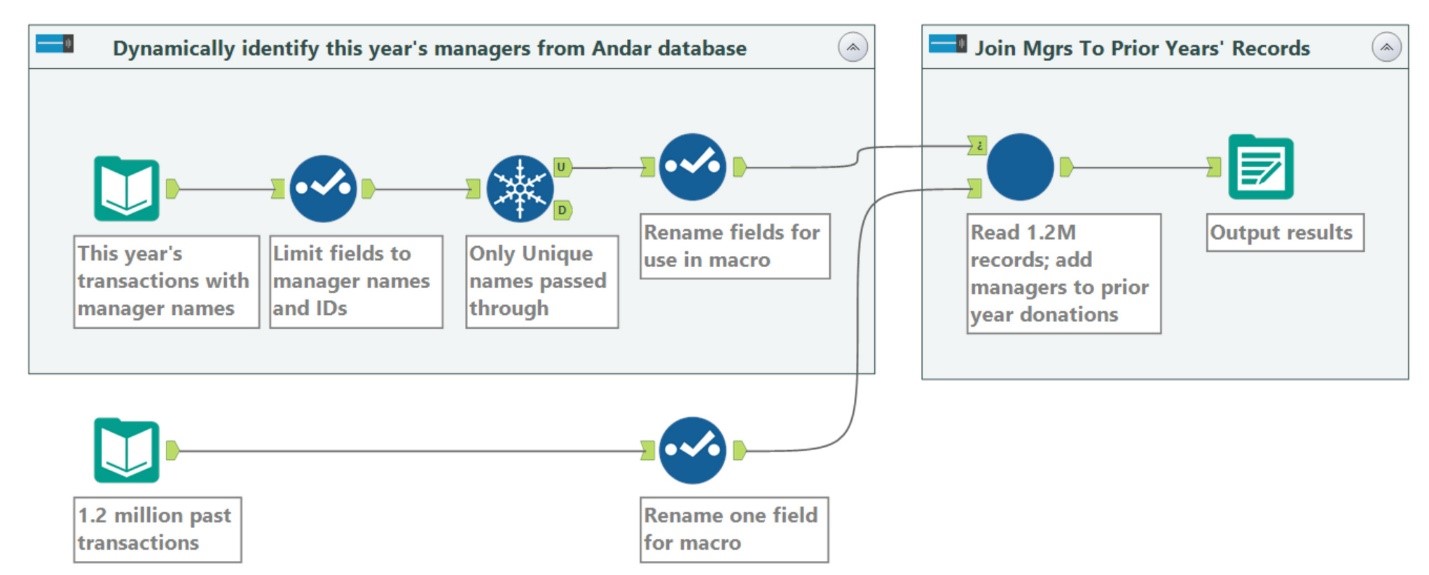
In addition, Metro United Way assigns important donor accounts to a dozen-plus in-house managers. A manager’s set of accounts changes every year, so the managers need tools to understand the pattern of each newly assigned account’s donation activities over previous years. Because of the changing assignment of accounts, the previous years’ transactions in the Andar database cannot be queried by manager and donor – the manager’s name wasn’t associated with that account in previous years. Alteryx solved that issue by reading through 16 years of transactions — 1.2 million records – and assigning today’s managers to the past donor activity. (This takes only a few seconds.) Now when fed into Tableau, the data shows each manager what their set of accounts has done in the past, and what patterns they exhibited over each year’s campaign.
The Alteryx workflow (below) dynamically scans the current year’s transactions to identify manager names and accounts. This means that if a manager’s assigned accounts change during the year, the look-back is automatically updated. If a new manager is hired, that new name also is automatically picked up during the weekly scan of current-year transactions.
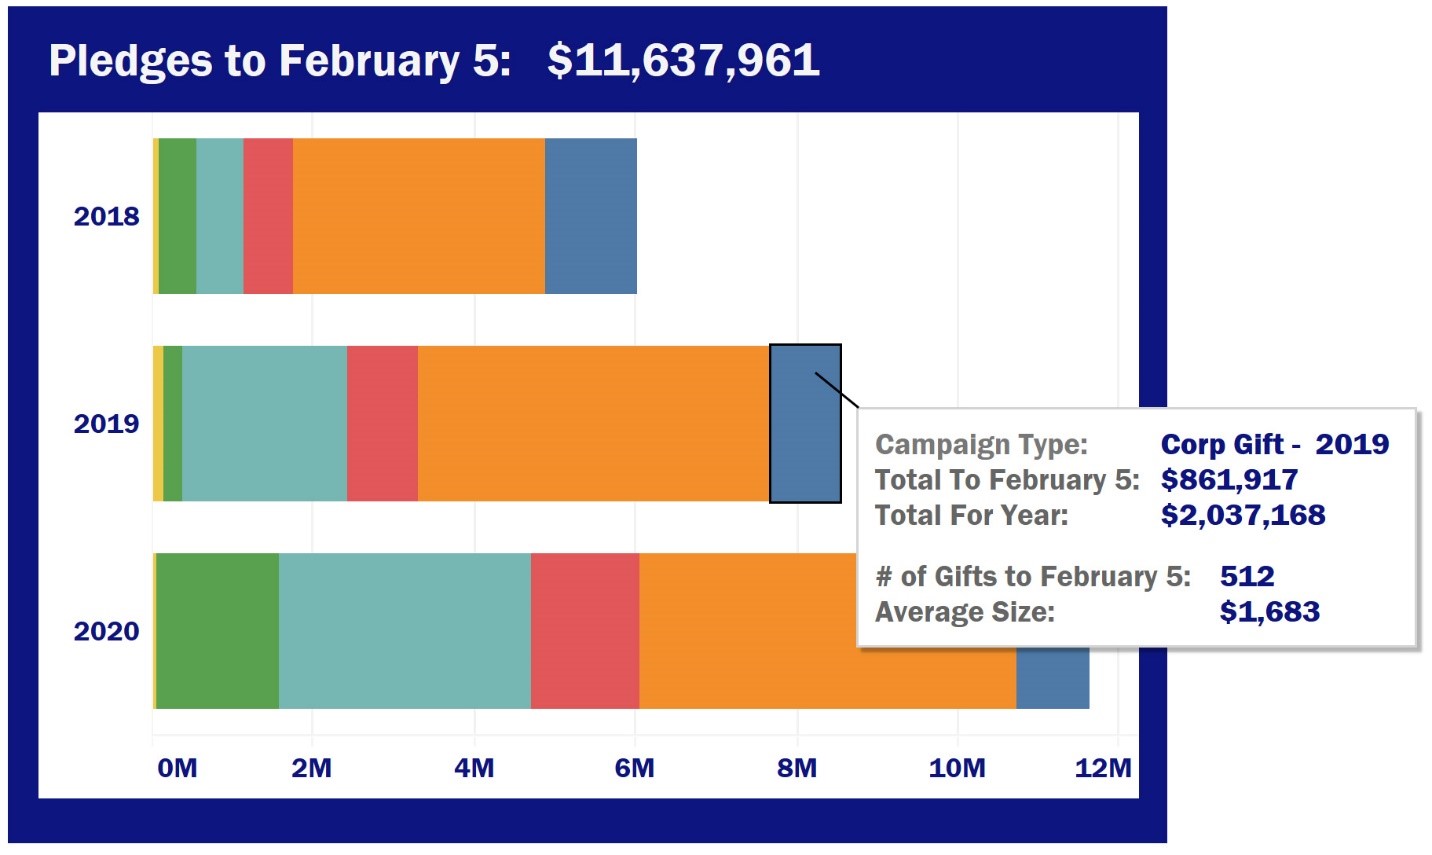
This United Way has several campaigns during the year – an Annual Campaign and various special funding drives. In addition, money can flow into each of these campaigns from several sources, such as payroll deductions, corporate gifts, sponsorships, and the like. Alteryx enabled charting of these multiple campaigns with both summaries of pledges-to-date and totals for the daily intakes, and the ability to drill down inside any of the campaigns to easily see where the money was coming from.
In the example below, the most recent pledges for the current campaign year (2020) were received on February 5, 2021. For the three most recent years, the colored bars summarize the various campaign types, such as “Corp Gift” while Alteryx provided the Tableau chart with detailed breakdowns on the number of gifts and their average size. For previous years, such as the 2019 tool tip shown, Alteryx calculated both the full-year 2019 amount and the pledges made up to February 5 of that campaign year.
However, occasionally the data includes outliers that distort the patterns. A campaign might receive a huge gift that will not be repeated. Alteryx enabled Metro United Way to create a mirror campaign record that omitted the one-time donation. Executives using Tableau could toggle between the two views – the actual record and one without the distorting event – to get better understanding.
An important metric for a donation-based organization is the age of donors, and the pattern of giving by age group over the years. Knowing the most generous age sectors enables better targeting of the organization’s effort. Alteryx easily created custom age brackets for analysis, breaking seniors into three groups instead of the usual single 65+ bin. Alteryx also did the calculations to reduce the donor’s age for each of the previous 16 years of donor records.
Only about half of the donors had known ages. Using Alteryx’s licensed Experian individual database, Metro United Way was able to match their names and addresses with the Experian records to discover another 2,000 birth dates. Alteryx was able to rip through the 200 million national Experian records and make matches in under five minutes, on a laptop.
Finally, Alteryx helped Metro United Way to clean its data prior to analysis. This included the way Andar output some fields with the date-of-the-query embedded in the field name – creating field names like “Manager_2021_01_08” in one week and “Manager_2021_01_15” in the next week. This wrecked attempts to consolidate data, or even let a Tableau chart continue working from week to week without manual intervention to accommodate the constantly changing field names. Alteryx can automatically change dozens of fluid field names into consistent names for every week’s run. The field can be “Manager” every week, or perhaps “Manager_2021” and with “Manager_2020” etc. for earlier years.
In all, Precision Analytics Group created several workflows to clean and consolidate incoming Andar and Excel data, and two dozen additional workflows to make calculations and summaries for more than two dozen custom Tableau worksheets and dashboards. PAG completed the Alteryx and Tableau work for the United Way in under seven weeks of labor. Custom coding using less nimble software approaches would have cost the client far more.
Contact us and let us know how we can help you with your data!