Covert Detection of Customer Service Problems
There is a back-door method to discover unhappy retail customers, to rectify problems that your organization may not realize exist. Poor customer issues can be like an iceberg – most unhappy experiences are submerged, and only a small fraction rise to where you can see them. Complaining takes effort with no assurance that it will be worth a customer’s time. In addition, people may lodge complaints at the local level but store staff may never pass them along to regional or national managers.
Our strategy works for companies with widespread retail locations – fast food and grocery chains, Starbucks and its clones, etc. – that have loyalty programs with customer home addresses. For any given sales region, the customers’ home locations are plotted on a map that also contains the locations of the company’s stores. Then the program looks for customers that are bypassing their closest outlet and making the effort to visit more distant stores.
Identifying these “avoided stores” can reveal outlets with problems that are unknown to regional or national managers. Perhaps service is slow, or surly. Perhaps the outlet isn’t as clean as its siblings, or occasionally serves moldy food. Gang members may have taken up residence in the parking lot.
The program developed by Precision Analytics Group uses the geospatial capabilities of Alteryx to take any customer list with addresses and automatically turn those addresses into points on a map. The Alteryx workflow then does the same for the addresses of company stores in that region, and computes which outlet is nearest to each home, and which outlet the customer actually travels to use. The closest stores that are bypassed on the way to a more distant outlet are revealed as the “avoided stores” needing further investigation.
For chains that don’t have any customer loyalty programs that track transactions, one possible workaround is holding a sweepstakes that requires customers to provide home addresses so they can be notified if they win. The entries will show where the customers shopped, and once their home addresses are plotted by Alteryx, regional managers will know whether these customers bypassed a closer store to visit the one where they placed their entry.
There can be confounding factors that muddle this type of avoided-store analysis. A person may patronize an outlet because it is close to where they work, for example. If time-of-purchase information is available, then all transactions close to lunch time could be ignored to reduce this factor. Another solution, if sufficient transactions are available, is to only consider store visits on weekends and holidays when few customers are at a work location.
Experienced senior managers know that any overt supervision system can be subverted to some extent. The “avoided store” approach is covert and does not rely upon the courage of local staff to communicate embarrassing problems up the management chain of command.
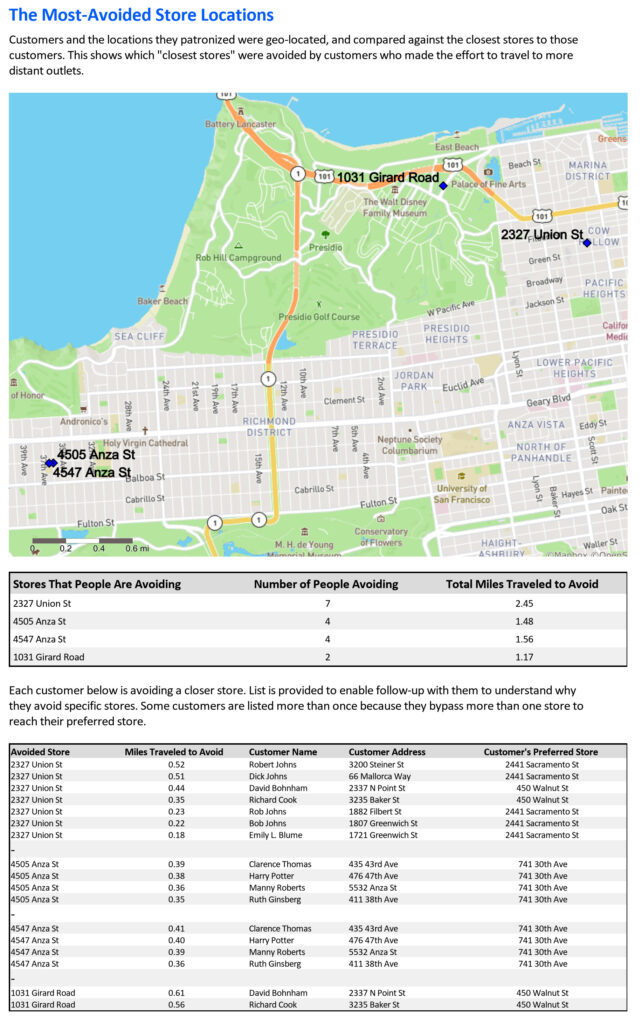
The following is an example of a report for the San Francisco area, showing the store locations that are the most avoided. (This is not actual data for a PAG client, of course.)
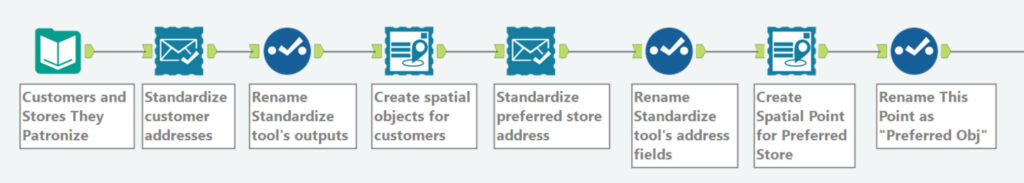
Here are the major portions of the Alteryx workflow. It starts by reading in a list of customers, their addresses, and the store addresses that they actually patronize the most. The CASS tools standardize all addresses according to U.S. Postal Service rules (substituting “St” for “Street”, etc.). Select tools then rename output fields like “CASS_City” back to “City” so the Geocoders can create geospatial points called centroids.
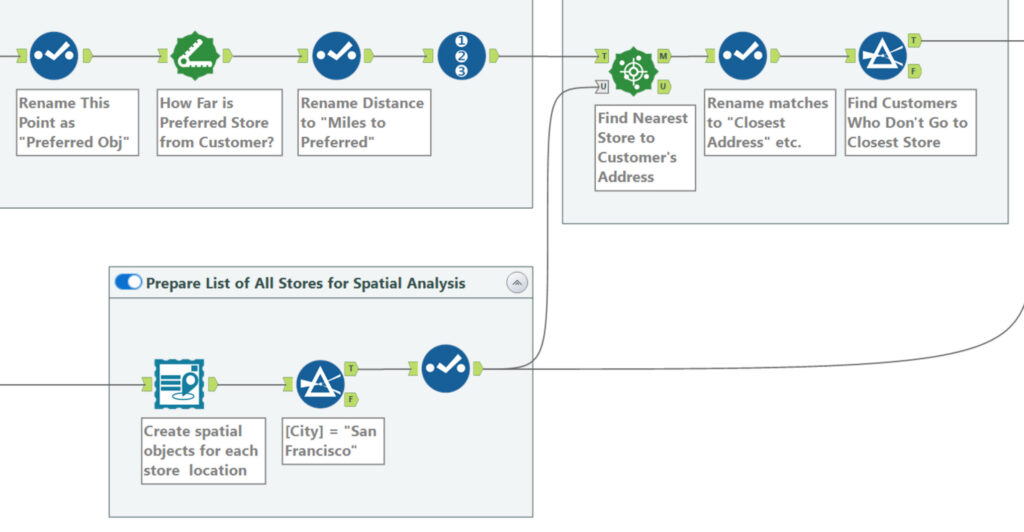
The bottom flow in the following image processes a separate list of all stores in the San Francisco area, assigning them centroids as well. The Find Nearest tool compares every customer address to every store address to discover each customer’s nearest store. This is then filtered to find customers who are not going to their nearest store, for whatever reason.
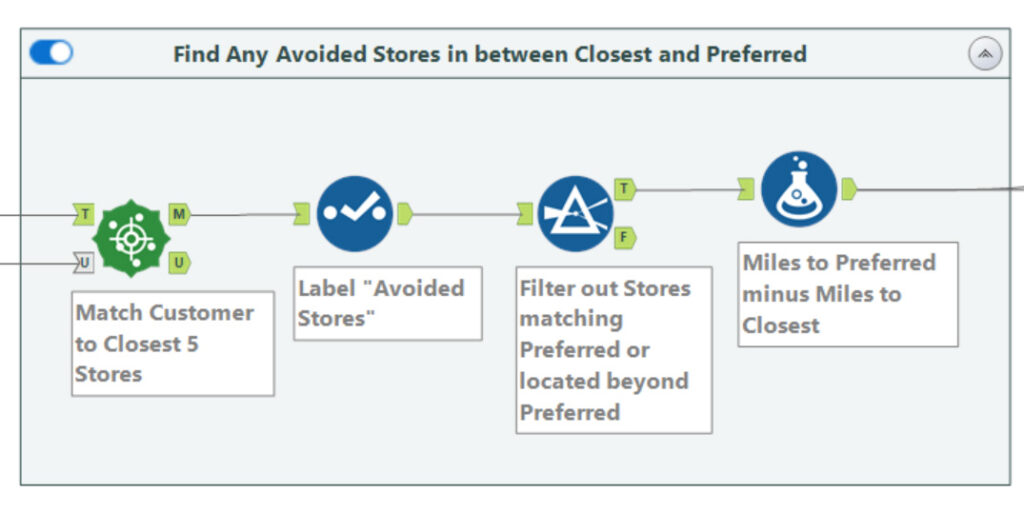
The next step looks for customers who bypass not only their nearest store, but additional stores in their search for one to their liking. The Find Nearest tool finds the five nearest stores to the customer’s home address, and then a Filter eliminates any that are further than the favorite store or are the favorite store. This leaves just avoided stores.
Finally, we use Alteryx’s reporting tools to create a PDF, PNG, PPT or Word output that top-level managers can use to identify problem stores. One pro tip when assembling a large number of inputs for the Layout tool is to rename each input from a number (like “#3” in the image below) to a descriptive label like “Headline”. Then when Layout asks you to arrange them in the right order, it will be easier to get it right the first time.
![]()