Alteryx Tool Spotlight – Browse Tool

One of the initiatives I plan to do more of this year is to highlight more Alteryx tools. There is no better place to start than the Browse tool. It is very easy to take this tool for granted because Alteryx developers generally slap it at the end of stream to view the entirety of the dataset. The Browse tool does much more than that. So let us get into all that the tool can do and some additional things that you may not know that it can do.
The Basic Definition
You want to use the Browse tool to view data from a connected tool. It only has one input anchor as shown above. This means that there is nothing you can do it with the tool. Is that true though? Let us put a pin in that and touch on that later.
You can see Data Profile information for multiple columns at once in a single holistic view, or for a single column of data. You can view information on data type, number of records, data quality, and a variety of statistics.
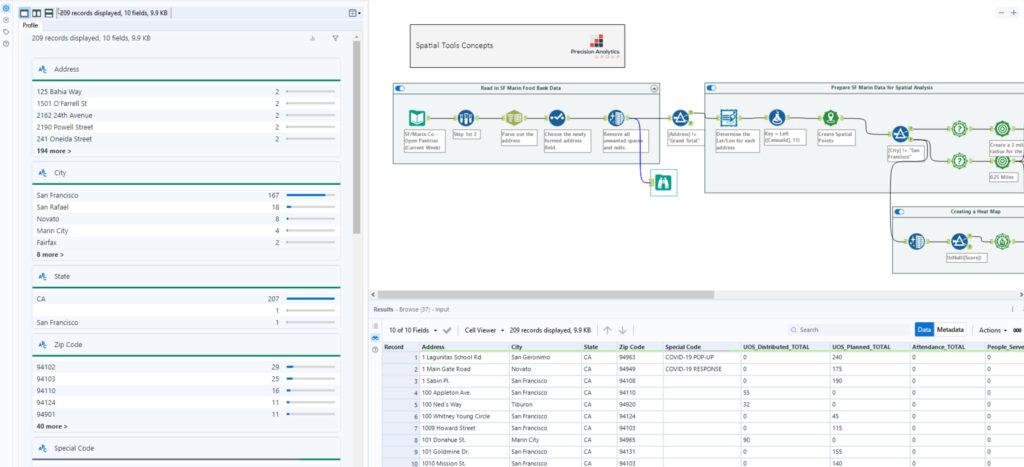
In the screen capture above, the Browse tool is connected to the Data Cleansing tool. The Browse tool will always show all the data in a dataset. Without the Browse tool, the Results window will show up to 1MB of data.
To the left, you will see the data profile of the fields in the dataset. This single view includes a container for each column of data, with the column name, a data quality bar, and a list of the column’s top values. The column’s data type is indicated by an icon to the left of the column name.
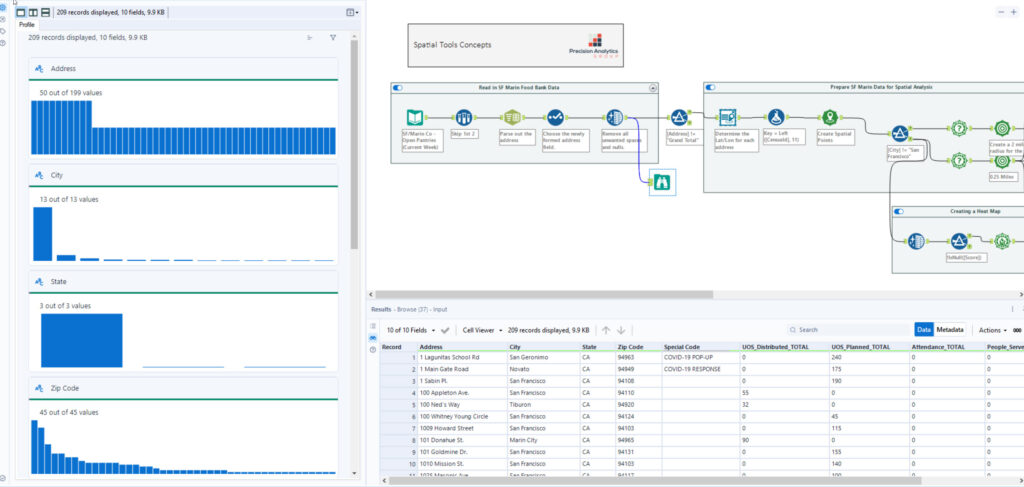
Select the bar graph icon to switch between the top values view and the data profiling chart view of the associated data.
Additionally, if a spatial, report, or behavior analysis data type is connected, another tab will be shown in the Browse tool. This tab shows a preview of the actual object on a Map or a Report.
How Do You Configure the Tool?
There are three ways to add the tool:
- Drag a Browse tool to the canvas and connect it to an upstream tool.
- Right-click on a tool on the canvas and select Add Browse After.
- Use the Shift+Ctrl+B keyboard shortcut and select the tools in a workflow.
You need to connect the Browse tool to the output anchor of the tool that contains the data that you want to view in detail. Again, having the Browse tool attached to the end of a tool display every record. Without the Browse tool, the Results window displays up to 1 MB of data by default. That’s an important tidbit for something called a Designer Core Exam. Just sayin’.
We have talked about adding the Browse tool(s) to your workflow. You may not want to use Browse tools in your workflow all the time. It’s important to save on resources and workflow execution time because for every Browse tool that exists in a workflow, it will show every records for that anchor. Given this, you may want to disable the tools.
Here is how you disable the Browse tools:
- Select a random point on the canvas to display the Workflow – Configuration window.
- In the configuration window, select Runtime.
- Check Disable All Browse Tools to make the Browse tools in the workflow unavailable. To enable Browse tools, uncheck Disable All Browse Tools.
Why do I love the Browse Tool
Personally, I use the Browse tool to troubleshoot data output. Yes, you can use the out anchors of tool, but it never gives you the full dataset of records. If I have added a detailed Formula tool meaning many complex functions creating multiple fields, I want to see if I missed any logic. The only way to truly see the record profile is with the Browse tool. If I am expecting a certain number of records to be a certain way, I doublecheck this total with the Holistic View of the Data Profile. If there is something off, I have somewhat narrowed down where logic issues could be.
Once I diagnose the problems with my workflow, I remove every Browse tool. Leaving those tools in can add to your workflow processing time because each of these browse tools creates a temporary .yxdb file. Writing these files do take some time, which does slow down the processing. Depending on how large your datasets are, this added processing time can be significant. Another tip is to utilize the “Cache and Run Workflow” option to further narrow down a logic issue.
Conclusion
I would challenge each of you take an Alteryx tool and find something new that you do not know about the tool to increase your depth of knowledge on it. Of course, strategies like this are great for studying for a certification exam but it also gives you more tools in your Alteryx toolbox. When developing in Alteryx, you do not ever want to be stuck because you may not know what options you have to accomplish an analytics act. You are probably asking yourself, what I did not know about the Browse tool. Having the ability to convert a Browse tool to a Macro Output tool is not something I have ever done. I have never had a use case in which this was required. Maybe it was just that I did not know to consider it. Now, I want to challenge myself to do this in a real-world example. I hope this has helped you understand the some of the strengths of the Browse tool.