Let’s get it started:
In the dynamic world of data visualization, Tableau stands out as a powerful tool that empowers analysts and data enthusiasts to transform raw data into meaningful insights. One of the key features that elevates Tableau’s capabilities is the use of Level of Detail (LOD) expressions. LOD commands enable users to create intricate and customized visualizations by providing a granular control over the level of aggregation in their data. In this article, we will delve into the world of Tableau LOD commands, exploring their significance, syntax, and practical applications.
What are the Basics of LODs:
Level of Detail expressions in Tableau allow users to control the granularity of their analysis independently of the visualization’s view. This means that you can create calculations based on various levels of detail, such as the entire dataset, specific dimensions, or a combination of both. LOD commands come in three primary flavors: FIXED, INCLUDE, and EXCLUDE.
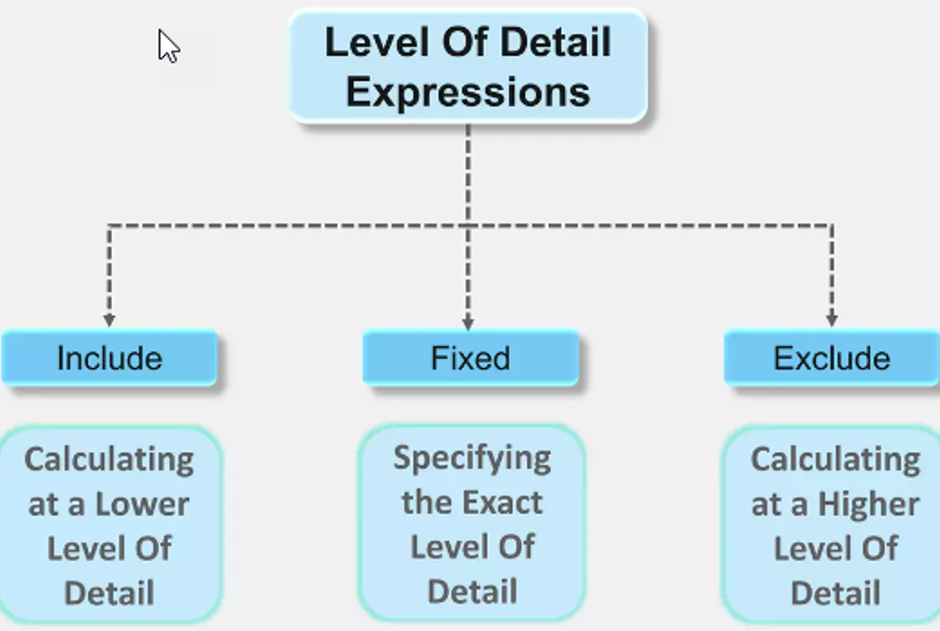
- FIXED: This LOD expression computes the result at the specified level of detail, regardless of the visualization’s view. It enables users to create calculations that are fixed to a particular dimension, ensuring consistent values irrespective of the dimensions in the view.
- INCLUDE: The INCLUDE LOD expression calculates the result considering the specified dimensions, allowing users to dynamically include or exclude dimensions in their analysis while maintaining a cohesive result.
- EXCLUDE: On the other hand, the EXCLUDE LOD expression excludes the specified dimensions from the calculation, providing flexibility in analyzing data without the influence of certain dimensions.
Practical Applications of LODs:
- Comparing Performance Across Categories:
– Example: Calculating the average sales per product category, fixed at the category level, allows for a fair comparison of performance across all products, irrespective of the current view in the visualization.

- Highlighting Outliers:
– Example: Identifying products that consistently outperform their category averages by using INCLUDE LOD expression.
- Filtering Data for Specific Dimensions:
– Example: Excluding a certain region from the overall average sales calculation to analyze the performance excluding that region.

- Creating Custom Aggregations:
– Example: Calculating the weighted average by considering both quantity and profit using a FIXED LOD expression.

Let’s Wrap it up:
Tableau LOD commands offer a sophisticated way to manipulate data at various levels of granularity, providing users with the flexibility to conduct in-depth analyses and create customized visualizations. As you become more acquainted with FIXED, INCLUDE, and EXCLUDE LOD expressions, you unlock the true potential of Tableau, turning your raw data into actionable insights. Experimenting with these commands in different scenarios will not only enhance your analytical skills but also elevate your data visualization game to new heights. So, go ahead, dive into the world of LOD expressions, and let Tableau empower you to tell compelling data stories.
