Can you switch an Alteryx Census workflow to Tableau?
Recently, Precision Analytics Group tried an experiment: Can Tableau Desktop do all the Census data manipulation that we usually do in Alteryx before feeding it to Tableau?
Census data presents two main challenges: Census field names don’t make sense, and usually you want to consolidate a dozen or more fields into just five or six for easier analysis.
Field names: Census labels are jumbles of letters and numbers, and the Alteryx Select tool clearly documents the re-naming of fields like “B19001l_002E” into understandable names like “Under $10K.” Every before-and-after name is instantly visible. Also shown with empty check boxes are the fields that you have eliminated in this step; these can be brought back instantly just by checking the box. See below:
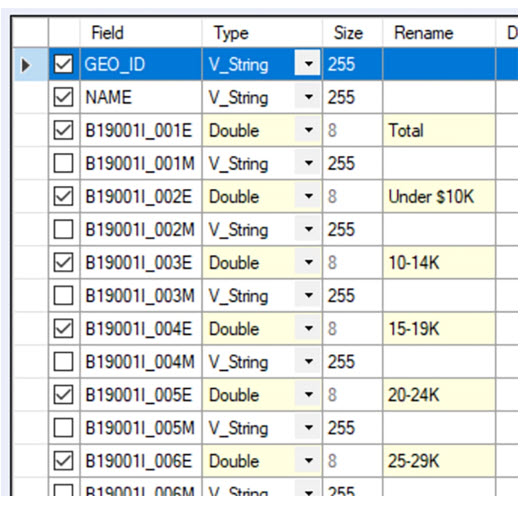
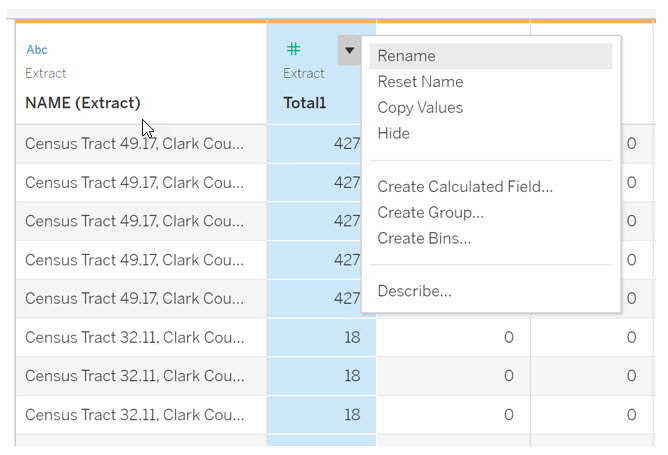
Tableau Desktop hides the original field names. Recovering from a mistaken series of re-namings that you did several fields back is a pain in Tableau. First you have to guess which fields got the wrong names, and then click each to “Reset” them to their original names. (Tableau Desktop also doesn’t automatically show which entire columns have been hidden; once you get them to show, there’s no way to make them live again.) See below:
Consolidating fields: Both Alteryx and Tableau easily group fields into new calculated columns. The problem in Tableau is that calculated fields cannot be pivoted (or Transposed, as Alteryx calls it). Census data will document income levels, for example, with separate fields for each level showing the population in that level per tract, county, or state. To get a bar chart showing population per income level, however, those separate income fields have to be combined into a dimension to be displayed on one axis with population levels shown on the other. Hence, the need to Transpose or Pivot the data.
Tableau only pivots “native” fields, while Alteryx doesn’t care if the column was created by calculation.
To be fair, there are two workarounds that let Tableau Desktop do Census pivots. One is to manipulate the data in Excel before feeding it to Tableau; the Excel-calculated fields become “native” to Tableau in that case. But using Excel to consolidate fields is challenging due to the Census field names. You’d be doing Excel calculations like “= B1901001l_003E + B1901001l_004E + etc etc.” while trying to remember what value each of those jumbles represents. Or, you could do the re-naming step in Excel first, so the Excel formulas made more sense. In that case, you’d lose the documentation of the re-namings that Alteryx retains.
Another workaround is to employ Tableau Prep prior to Tableau Desktop. Tableau Prep retains the before-and-after field names, and after creating the new fields for quintiles, it too can pivot them just like Alteryx. Pretty simple, if you already know how to use Tableau Prep.
In any case, the original experiment was to see if Tableau Desktop could handle Census data directly, and the answer is no, if you need to consolidate multiple fields into simpler ones. You have to use Tableau Prep, Alteryx, or a mistake-prone kludge in Excel to get the data ready.