How to ingest PDFs using Alteryx Intelligence Suite
Alteryx has retired its previous tools for reading PDFs into data files and has new tools as part of the extra-cost Intelligence Suite. That suite can do sophisticated analysis and classification of photographic images; in this blog post we’ll just show how to use Intelligence Suite for PDF ingestion.
The three tools needed are the Image Input to read PDFs, the Image Template to mark sections of the PDF to extract, and the Image to Text tool to use the template to screen the PDF images. Alteryx assumes you will be doing batch conversions of multiple PDFs, so you first need to direct the Image Input tool to a directory holding the multiple PDFs. (Or a single PDF, if you’ve got just one to read.)
Here’s how these three get connected:
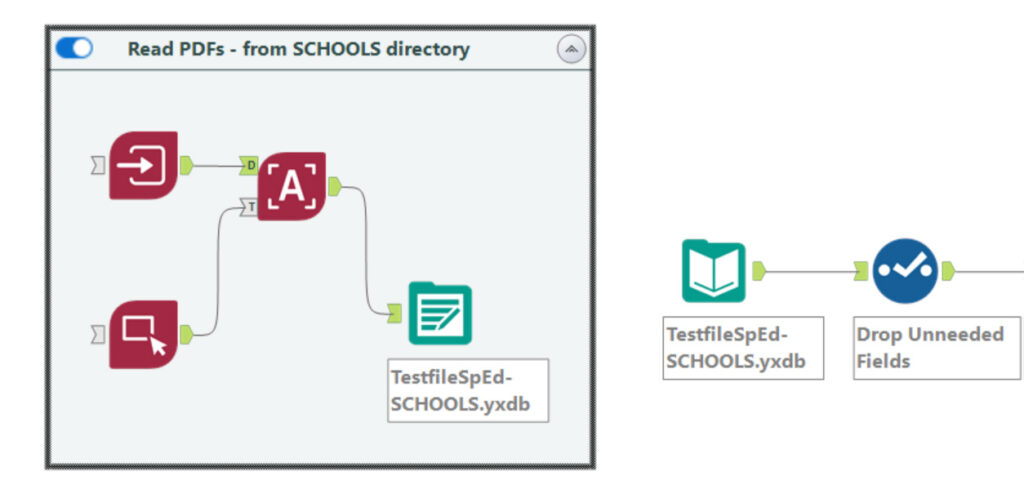
Because the process of reading even a handful of PDFs can take a few minutes, my practice is to output the results to a .yxdb, then copy that output tool outside the container, and click it into a matching input tool. Then I turn off the container. As I go through the trial and error of breaking the text blocks into useful bits, I don’t have to wait for the whole reading-in process to repeat itself.
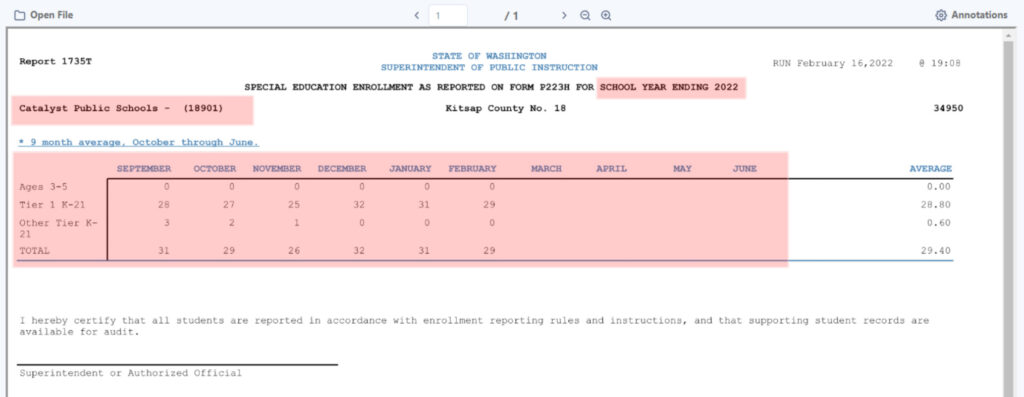
In that container, you must teach the Image Template what portions are important to convert to data. This done by selecting one of the PDFs as an example, and then drawing boxes around the key parts, and naming the boxes. Each named box will come across as its own field. This means that the PDFs in your batch need to have very similar layouts. Modest shifts in formatting among PDFs can cause the process to produce gibberish.
Another hint about marking the template is to include more of the text than you actually want. For example, in the “Catalyst Public Schools – (18901)” block, I did not really want the hyphen and the parenthetical number. But if I marked off just the school name, then District Names in other PDFs that were longer got cut off. Later in the workflow, I used Formula logic to trim things back to the data I wanted.
The three blocks in red were named “School Year Ending”, “District Name”, and “Special Ed”. The following image shows how each became a field in the data stream.
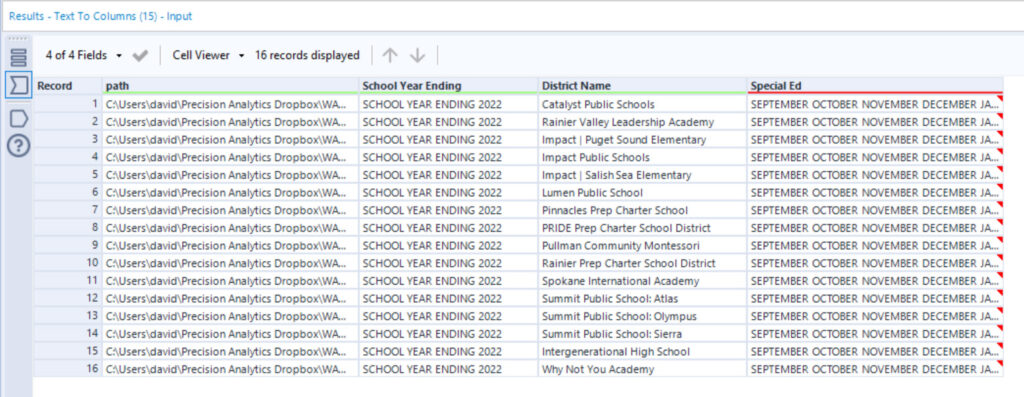
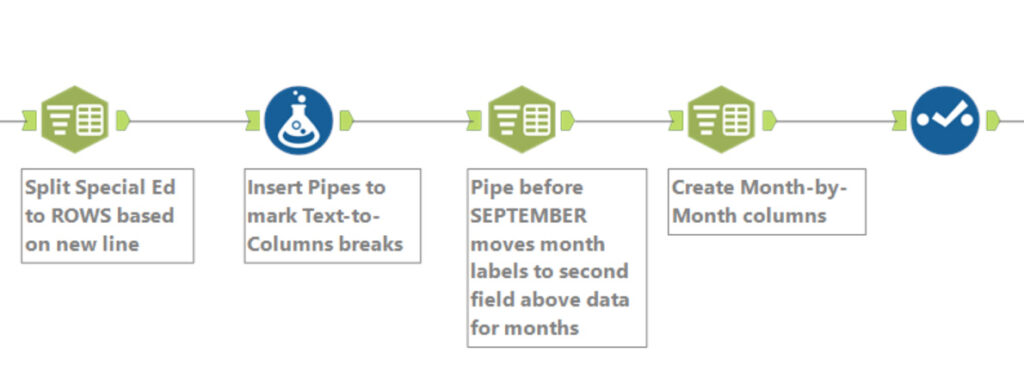
The data-intense Special Ed field came across all jammed up, to use a technical term. (To understand this compacted field, I copied and pasted one cell into Notepad, and could see how the data was arranged.) The next step was to use the Text-To-Columns tool in Text-to-Rows mode to break up the Special Ed field based on the new line character.
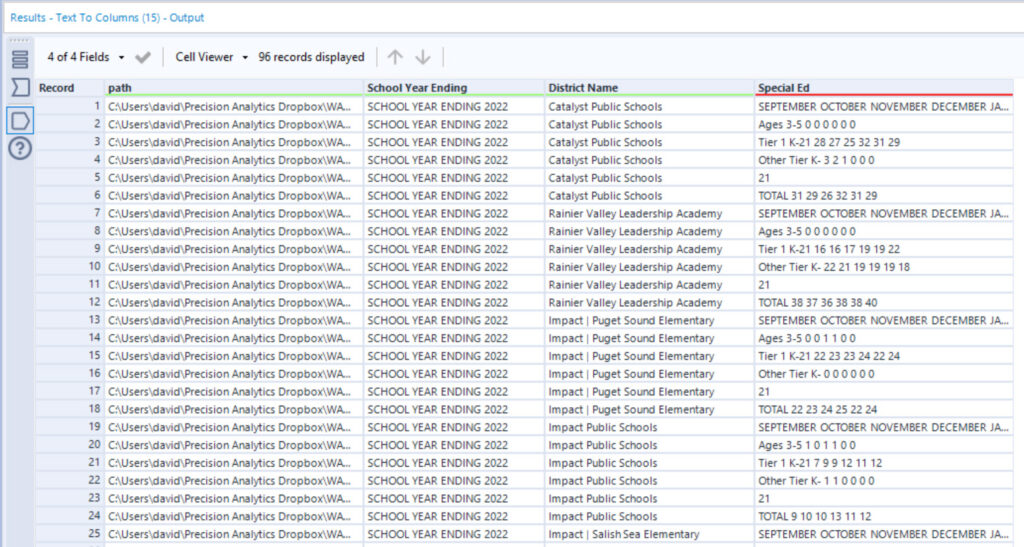
Each District’s data in the Special Ed field was split into six rows. Below is how the workflow looked through this point:
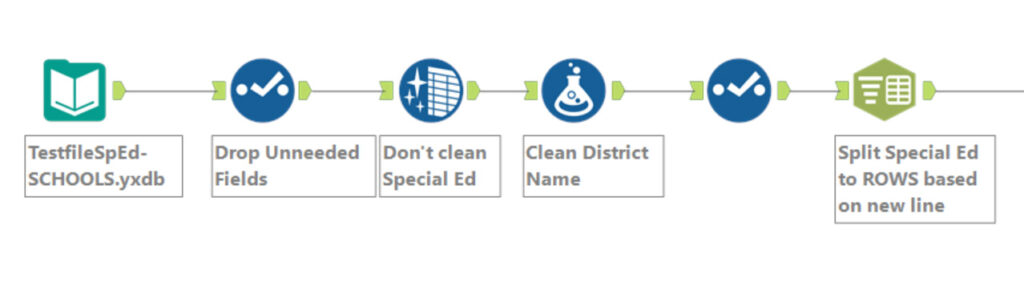
The Data Cleaning tool was configured to skip cleaning the Special Ed column because that field contained special characters needed for later splits.
Next, the Special Ed column needed to be broken into two columns, one for the row labels (“Ages 3-5”, “Tier 1 K-21”, etc) and one for the numeric data for each month.
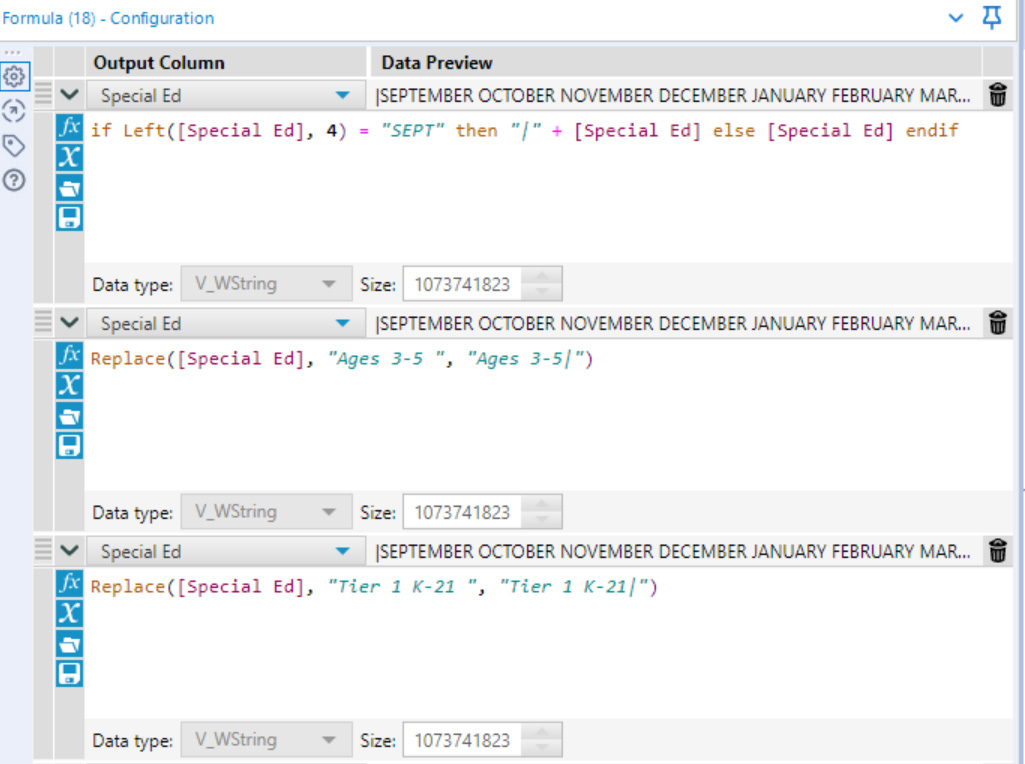
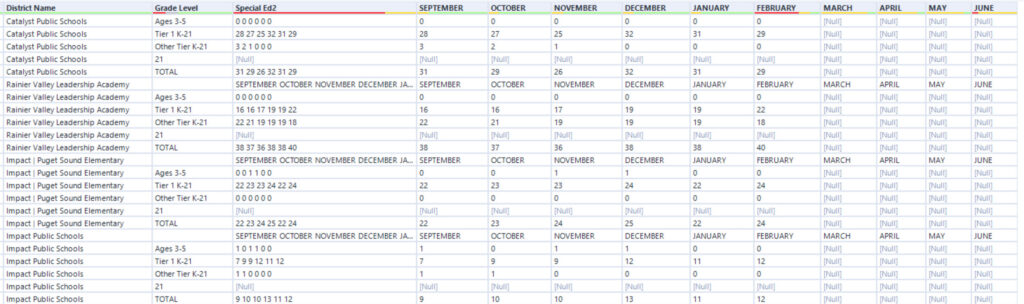
First, a Formula tool inserted markers for where the column should split. In this example, the Formula tool put a pipe symbol after the row identifiers and before the data. The Formula tool also inserted a pipe symbol at the very beginning of the string of months, to move that string into the data column, as shown below.
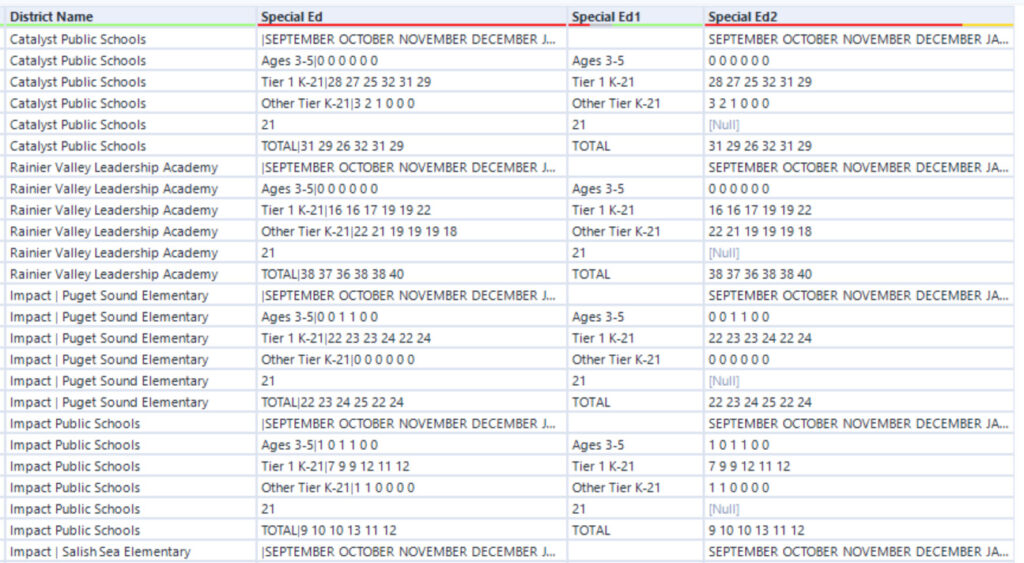
When run through the next tool – a Text-to-Columns tool – text was split based on the pipe symbol, with the identifiers in one column (Special Ed1) and the data in the second (Special Ed2).
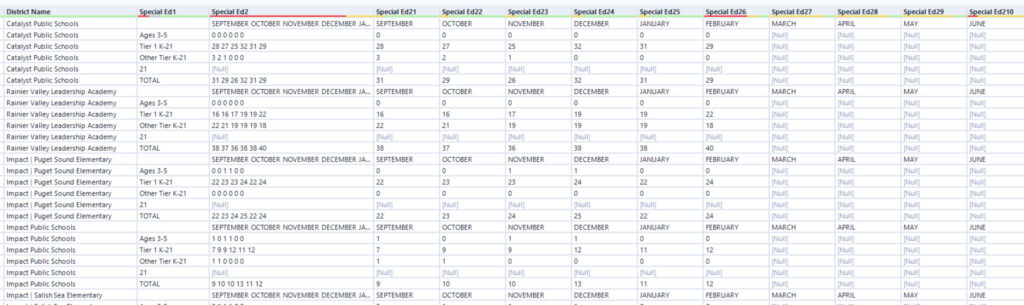
Another Text-to-Columns tool used spaces to split Special Ed2 into the nine months contained in the data set.
Here is the workflow to this point:
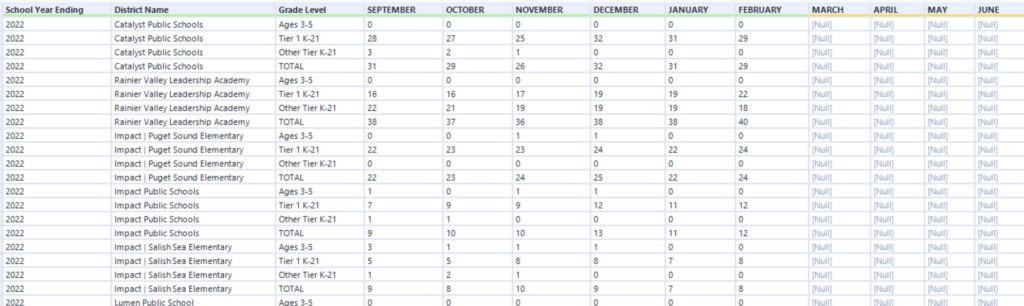
The next step was a Dynamic Rename. This tool was configured to just examine the columns Special Ed21 through Special Ed210 and use the data from the first record to rename the columns. The result is shown below.
So close to useful!
I set a Filter tool to discard any row where the September column contained “September” or a Null. A final formula found the four-digit School Year in the “School Year Ending XXXX” field.
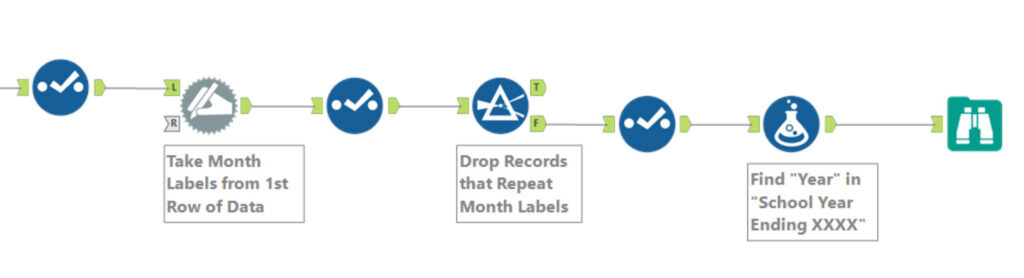
The input tools can misread some combinations of letters. In this project “Tier” sometimes came across as “Tiler”. One of the Districts had two misreads in the data, with a 7 coming out as a period and 9 coming out as a lower case g. The final steps turned those into Nulls. You might include a data-quality checker to see if Nulls are present where they are not expected.